Top 100 Musical Artist Data Visualization
An infographic featuring the top one-hundred musical artists during the week of September 1st, 2024.
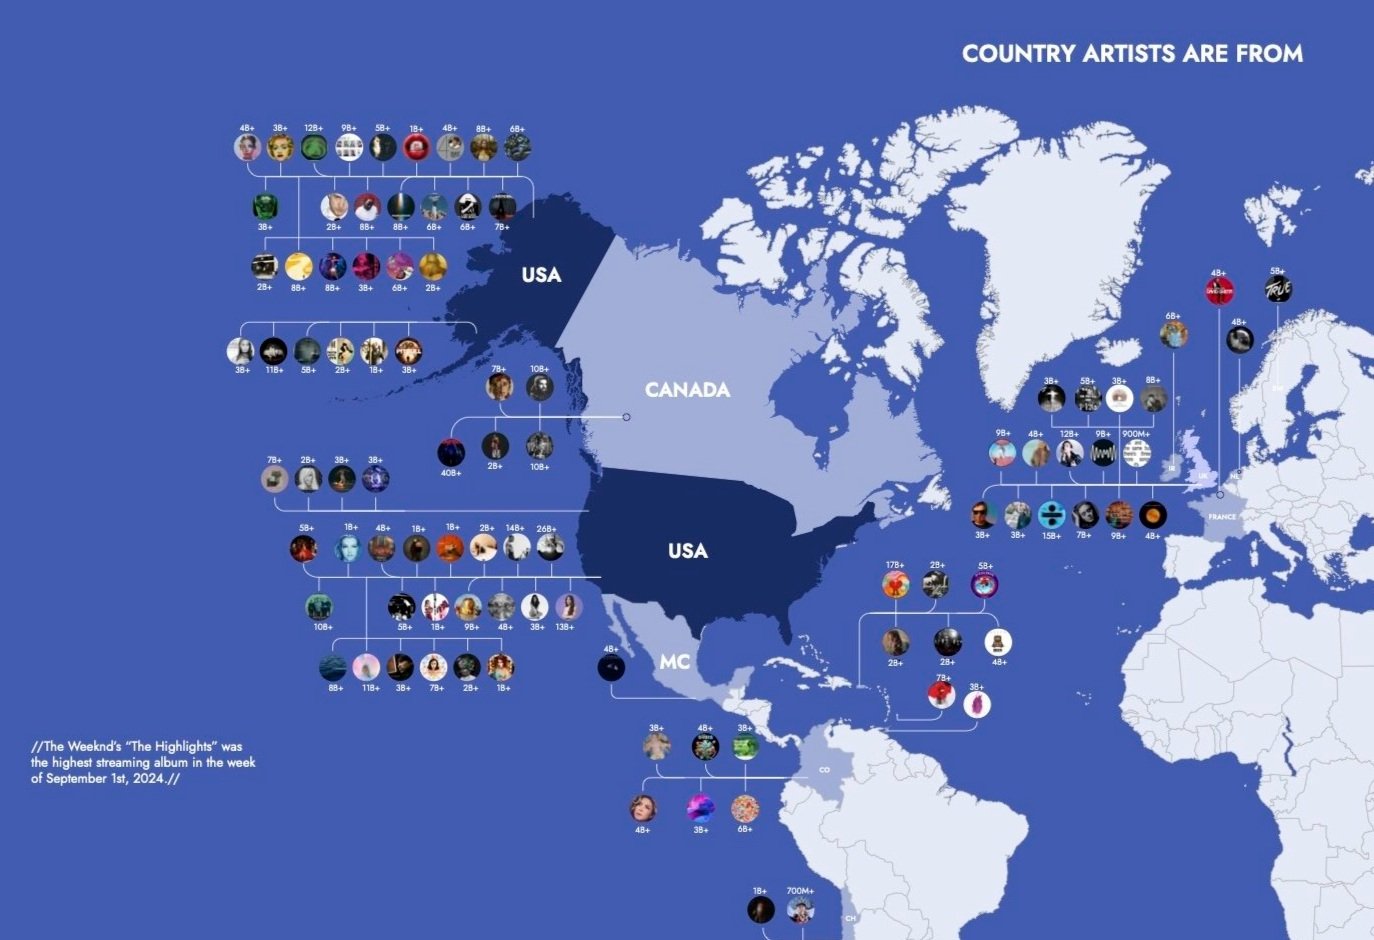
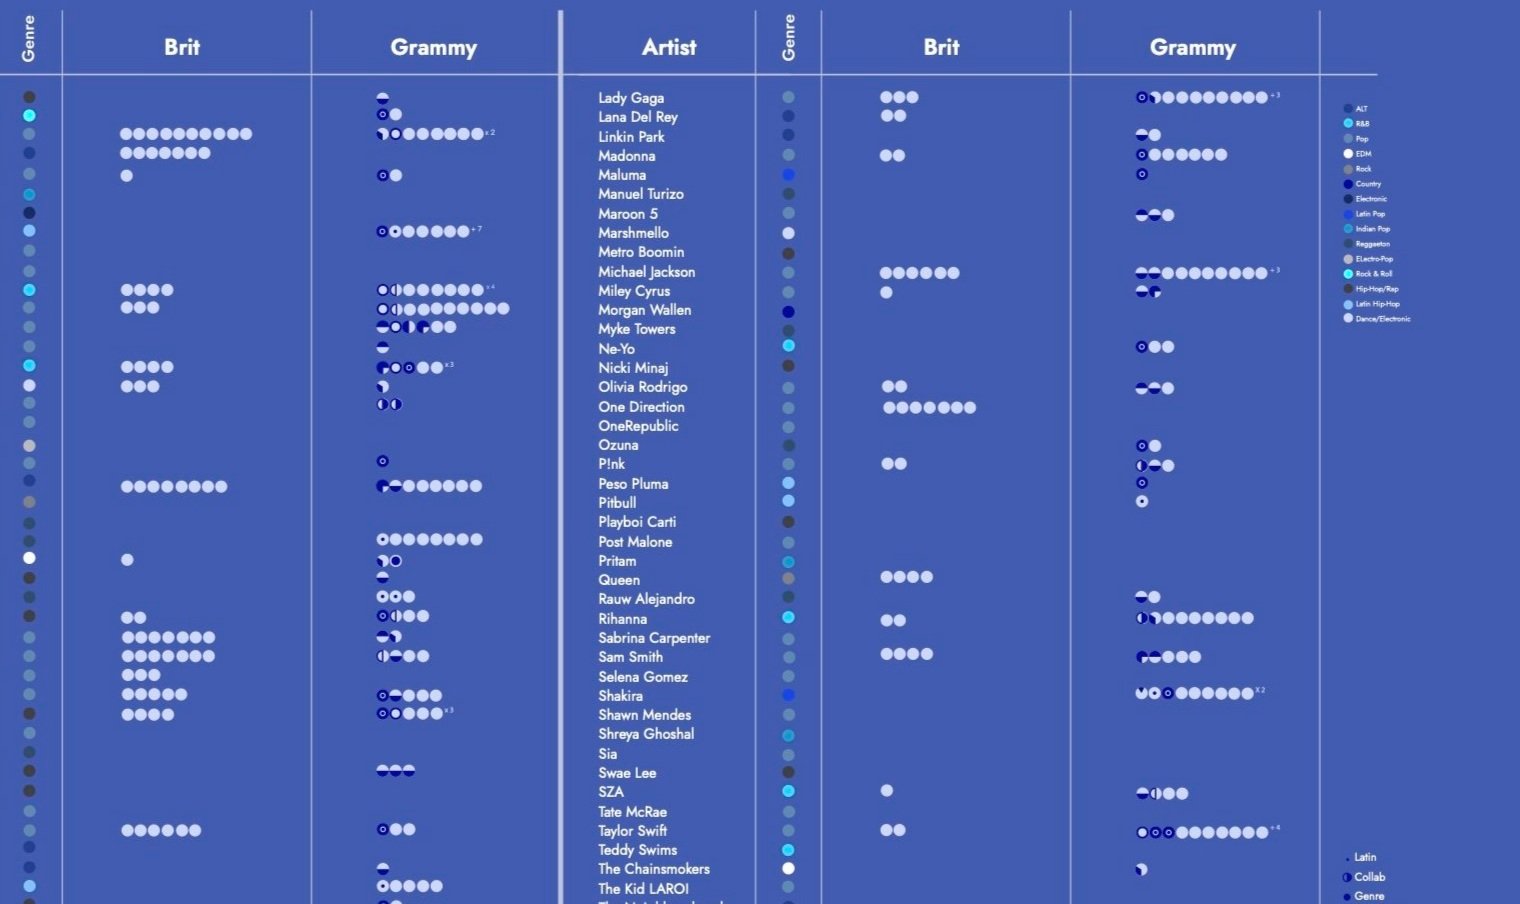
This infographic features the top one-hundred musical artists during the week of September 1st, 2024. The infographic is broken up into three parts: the country of origin, awards won, and monthly streams for each artist. Graphics range from map vectors to piano keys with information that relates to each artist. Each of the three parts includes additional information, including each artist’s top streamed album, winning award categories, and interesting facts about them. A range of blues were used to highlight information throughout the infographic.
32 x 48 inches
A Closer Look


Part 1 - The ranking of each artist based on monthly listeners. This information is placed in a bar graph that looks like piano keys.
Part 2 - The countries the artists are from, along with their most popular albums and stream of the album, all placed on a map.
Part 3 - Awards each artist won along with their genre.
Process & Inspiration
Sketched ideas for the three graphs.
Powerpoint slide presenting the proposed topic.
The second graph showing the countries each artist is from before color was added.
The final layout being tested with different color pallets.


